
The Boston Consulting Group Matrix Corporate Analysis Tool
The Boston Consulting Group (BCG) matrix is a corporate analysis tool used to analyze and assess various departments and products or services within an organization. This analytical tool is used in determining the profitability of a certain department, product or service within an organization. The matrix has four quadrants and each quadrant shows a different level of productivity in terms of return for the organization (Orcullo, 2007). Apart from showing the return rates, the quadrants also bear significance in terms of showing future or present productivity in terms of return. BCG was developed in 1970 by Bruce Henderson of the Boston consulting group to specifically help organizations in analyzing their product or service lines as well as business units or departments (Griffin, 2012).
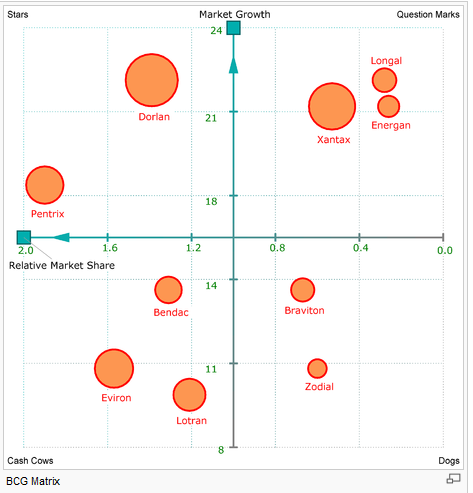
The BCG matrix has four quadrants-the upper left quadrant is known as the stars quadrant. The upper right quadrant is known as the question marks quadrants, whereas the lower left quadrant is known as the cash cows quadrant. Finally, the lower right corner quadrant is known as the dog’s quadrant. The cash cow’s quadrant is occupied by units that generate excessive returns compared to the amounts required to run the business, and virtually all organizations desire to own cash cows. The best advantage is that they can be exploited without any need for extra investment. These units typically occur in slow growing markets.
The dog’s quadrant is occupied by units that generally generate returns that can barely maintain operations of the business (Orcullo, 2007). Therefore, these are units that generally “break even,” but do not generate profit or losses. These units are not beneficial to the running of the business, but they perform a social benefit of providing synergies and jobs that assist other units within an organization to run. However, it has to be noted that some dogs cannot be done away with if they supplement certain functions. These units depress return on assets ratio within an organization. The question marks alternatively termed as the “problem child” are units within an organization that are on a rapid growth.
These consume a lot of money, but do not generate as much as they consumer. These units have a chance to gain greater market share and profitability in the future and thus become cash cows (Value Based Management.net, 2012). However, if this fails the question mark may turn into a dog after a long period of investment consumption (Orcullo, 2007). This usually happens when the market declines. The fact that question marks consume a lot of investment funds without significant return requires a clear analysis to determine whether they can be profitable in the future and be able to repay their consumption. The stars are units that have a high share or rate of return, but their returns are shadowed by the first growing industry. Their profitability only emerges when the organization’s or market’s growth slows down and they become profitable. Therefore, the stars have the ability of becoming the cash cows when the market dynamics change. These are also high investment consumers and as such their sustenance is costly and requires analysis so as to determine whether the unit deserves the amount that it takes. Alternatively, there is a possibility of such units turning in to dogs (Griffin, 2012).
The findings presented by the case in question shows that the electronics division is a ‘question mark’ because it is on the upper right quadrant of the matrix, whereas the appliance department is on the lower left quadrant and thus a cash cow (Value Based Management.net, 2012). These findings suggest that the electronics department consumes relatively high investment and is under rapid growth. However the department has a low market share and generates little return and as such does more consumption than generation of income for the organization. If the future of the organization is good the unit has the ability to gain a greater share and become a star that could finally become a cash cow when the growth slows within the organization. However, if this department cannot grow into a leading department there is a likelihood that it will become a dog if the growth within the organization slows. On the other hand, the appliances department is a cash cow that consumes very little investment and generates more income than it consumes. The department is also slow growing by nature of its position.
As a matter of recommendation the appliances department should be well maintained because it is the big earner and its returns are the sustenance force within the organization. On the other hand, the electronics department is a unit shrouded in uncertainty due to the fact that its future direction is not yet known. The department is a ‘question mark’ with equal possibility of upgrading to a star and finally a cash cow or a dog and since this cannot be currently determined, it would be prudent to have a comprehensive analysis of the unit to determine whether it has a bleak or bright future. This is essential because ‘question marks’ such as the electronics department are high consumers of investment funds, and if they turn out to be dogs, the, that means great losses for the organization. Therefore, future projections on the growth of the organization, the department and the market in general should be critically analyzed to avert any negative outcomes that may drive the department and organization into a loss.
In the strategic analysis and decision-making that follows these findings there should be a clear understanding that the results of the analysis are based on a momentary time-frame and do not in any way reflect the future of a department within the organization (Management Study Guide, 2011). Therefore, there is a need for the organization to learn that reliance on this matrix’s categorization of the departments only suits the moment and any analysis that is limited to the moment because as noted the units could easily move along the matrix into different quadrants. These shifts and changes occur with market and organizational dynamics, and since the market and organization are in a dynamic motion, the reliance attributed to this information should be fixed to the time-frame in which it lies.
In order to reinforce or negate the assumptions made there is a need to use other analytical means to determining productivity of the various units within an organization. The ROI (return on investment) is perhaps the most important ratio in determining how substantial the truth on classification is within the matrix. The return on investment is an important measure in this case because it will help in determining how much investment each department consumes and how much it gives back in return in comparison to the invested amounts. The projection of profitability through time in the case of question marks, are also a very important measure in predicting the probable future growth and profitability. The changes of trends through time should be able to tell whether a question mark should be retained or sold out if at all it does not hold a significant supplementing support for the business (Management Study Guide, 2011).
In conclusion, the BCG offers a good momentary view of how each department is performing within an organization. However, it should be noted that it does not offer a precise future view on how each department may transform. As such, after acquiring a momentary view, there is a need for further analysis so as to determine the best measures on strategic management that should be pursued.
References
Griffin, W. R. (2012). Management, 11th edition, Cengage
Learning Management Study Guide (2011). The BCG matrix: Limitations of BCG Matrix, retrieved on 15th July 2012 from http://www.managementstudyguide.com/bcg-matrix.htm
Orcullo, N. (2007). Fundamentals of Strategic Management, Rex Bookstore, Incorporation
Value Based Management.net (2012). The BCG Matrix: Product portfolio, retrieved on 15th July 2012 from http://www.valuebasedmanagement.net/methods_bcgmatrix.html